 Global
 Singapore
 United States
 Hongkong
 Group
Group
US Macro Strategy Weekly Report
23 Oct 2023
By James Ooi/ uSMART Market Strategist
- Over 13 years of experience in buy-side and sell-side of capital markets
- Former Fund Manager of renowned asset management firm
- Focus on fundamental analysis and macro-outlook for US & Singapore markets
- SGX Academy trainer
This Week’s Market Outlook:
- The most significant economic data this week includes durable goods orders on Thursday, Q3 GDP, and core PCE inflation data on Friday.
- The Fed has entered a blackout period, during which members of the FOMC won't make statements to the press.
- This week is a significant earnings week. Four out of the "Magnificent Seven," namely Microsoft, Alphabet, Meta, and Amazon, are reporting earnings this week.
Oct 24 (Tuesday): Coca-Cola, Verizon, 3M, GE, Spotify, GM, Microsoft, Alphabet, VISA, Texas Instruments
Oct 25 (Wednesday): Boeing, Thermo Fisher, Hilton, T-Mobile, Meta, IBM, ServiceNow
Oct 26 (Thursday): Merck, Amazon, Enphase, Intel, Ford, Chipotle
Oct 27 (Friday): ExxonMobil, Chevron
- Most of the companies reporting Q3 earnings this week are expected to show better earnings year-over-year growth than Q2. However, this does notguarantee that they will beat earnings expectations or provide forecasts better than market expectations. Investors are looking for companies that surpass market expectations to sustain the market rally.
- According to CME Fedwatch, investors anticipate a 0% likelihood of the Fed increasing rates in the November FOMC meeting. Rates are expected to remain stable for the remainder of 2023 (Figure 1).
Figure 1: Meeting Probabilities
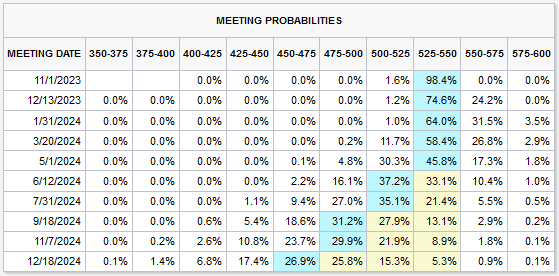
Source: CME Fedwatch, 23 Oct 2023
- The Fed may choose not to raise interest rates in the upcoming meeting, as soaring bond yields are achieving the bank's objectives. Since the last rate hike in the July FOMC meeting, the 10-year bond yield has climbed by 113 basis points, reaching 4.9928% from 3.8658% (Figure 2). The recent surge in long-term interest rates has already achieved what the Fed intended, making additional increases in FOMC rates unnecessary.
Figure 2: 10-year bond yield vs Fed Fund Rate
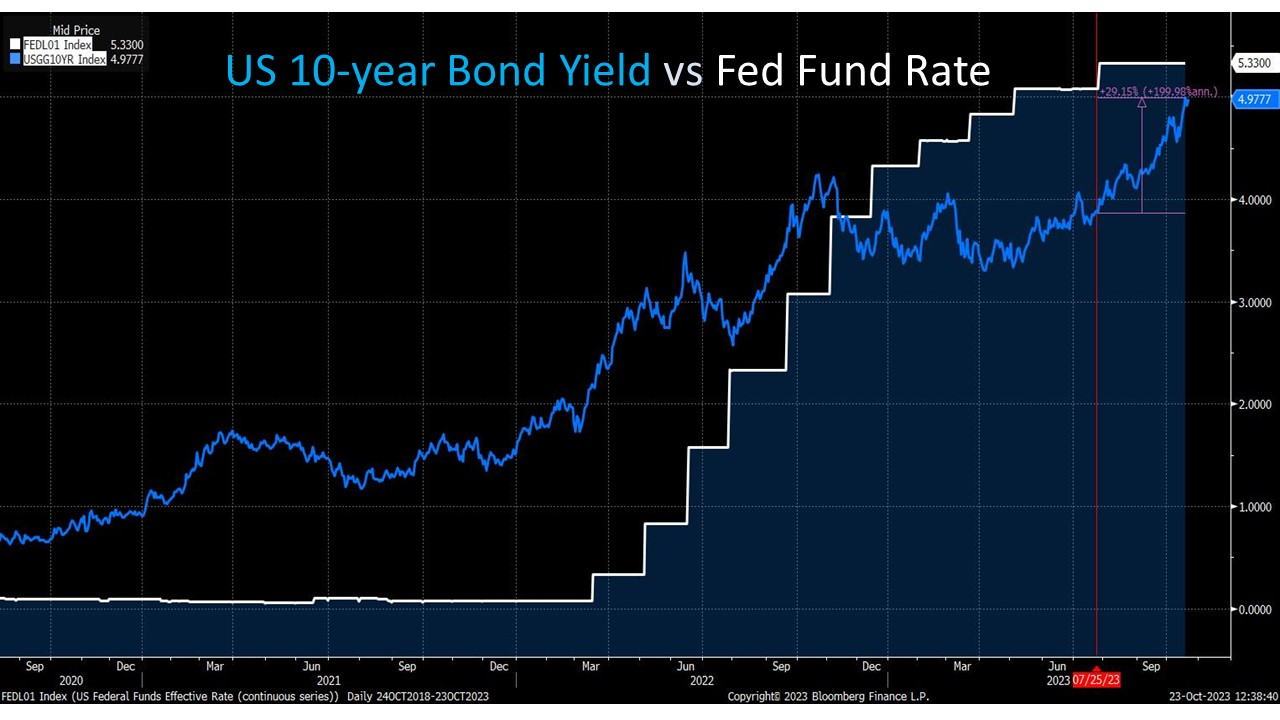
Source: uSMART, Bloomberg, 23 Oct 2023
- S&P 500 has failed to break below 50% Fibonacci Retracement Levels on several occasions (50% retracement of Oct 2022 Low to Dec 2022 High, and Oct 2022 Low to Feb 2023 High). Therefore, we consider the immediate support level at 4,207 (50% retracement of Mar 2023 Low to Jul 2023 High) crucial to monitor (Figure 3).
- The S&P 500 is just a step away from dropping below the 500 SMA at 4,204 (Figure 4). Hence, we will turn bearish in the near term if the S&P 500 falls below 4204-4207.
Figure 3: Fibonacci Retracement Levels of S&P 500
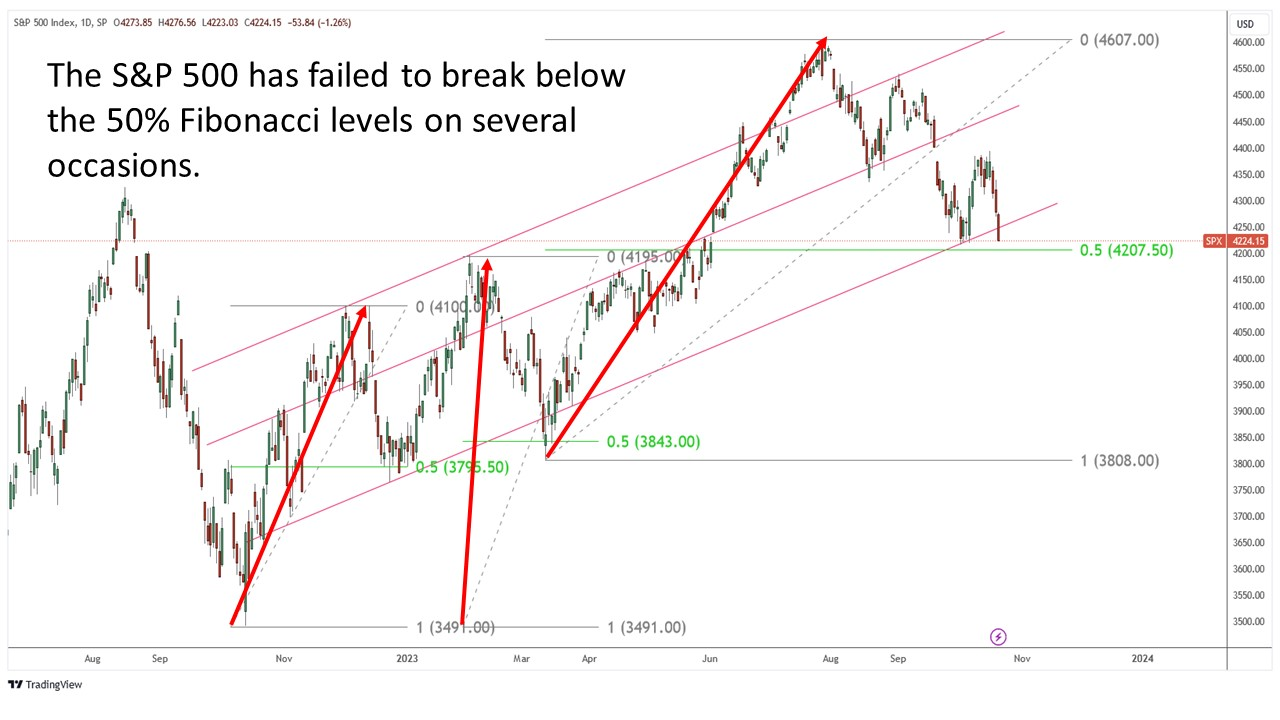
Source: uSMART, Tradingview, 23 Oct 2023
Figure 4: 500 SMA of S&P 500
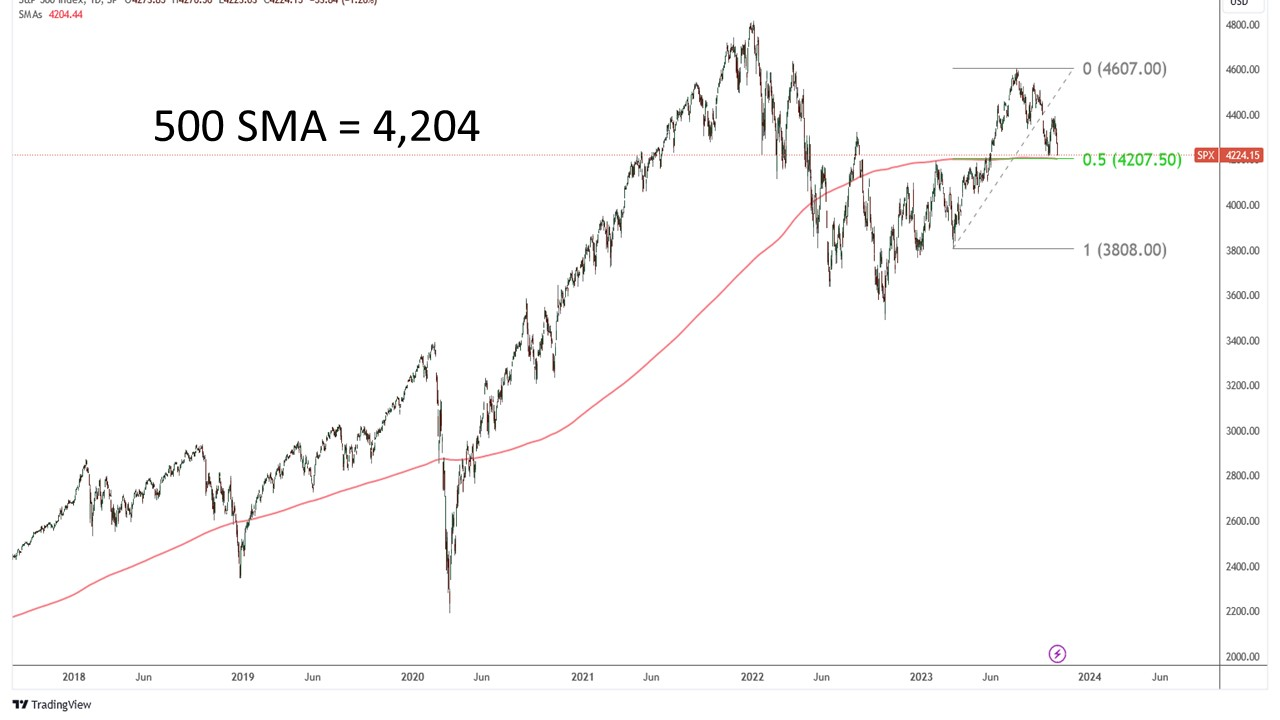
Source: uSMART, Tradingview, 23 Oct 2023
- Equity investors are displaying some real fear, with the VIX index surging to 21.71 on Friday (Figure 5). This marks its highest level in 7 months and the first time it has crossed 20 since May 24. While based on seasonalities, VIX should generally fall and S&P 500 should rally in the 4th quarter, investors should also brace themselves for a potential final equity capitulation should VIX continues to surprise us on the upside.
Figure 5: VIX Index Vs S&P 500
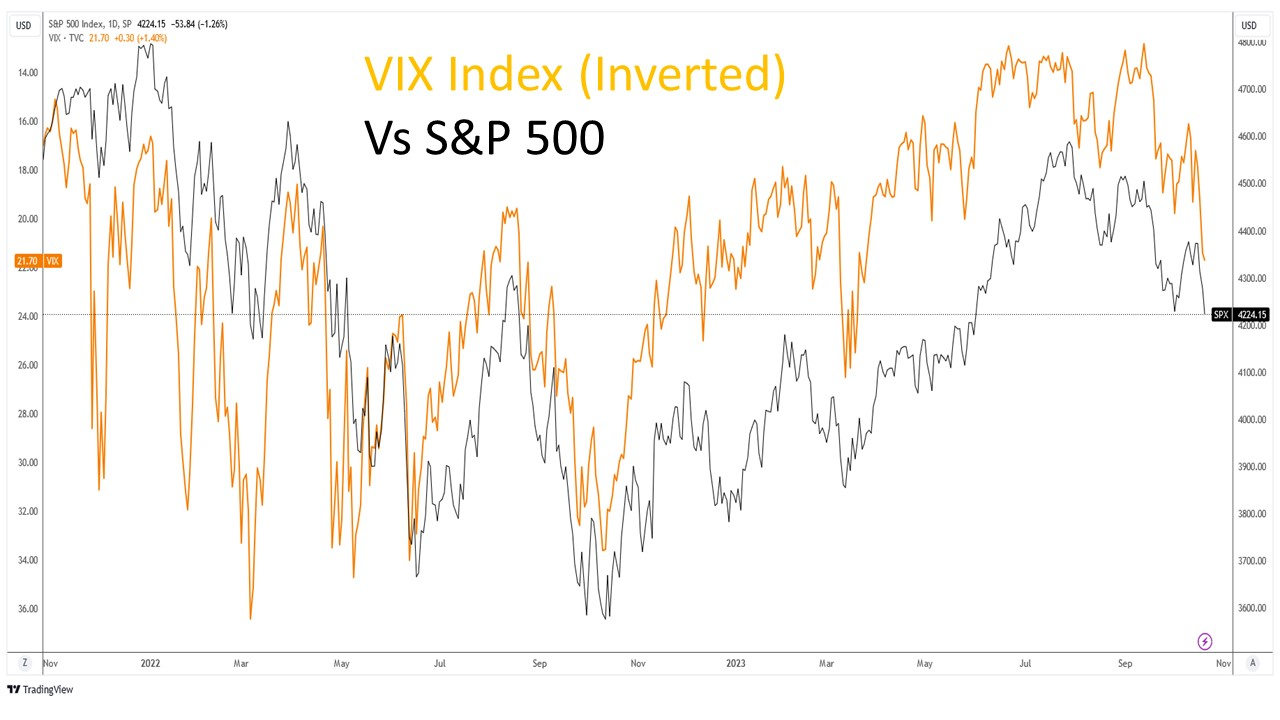
Source: uSMART, Tradingview, 23 Oct 2023
- In summary, we would like to reiterate our S&P 500 drawdown target, which we mentioned in August. If this follows a typical second-half drawdown pattern, the S&P 500 should have found strong support at the 4223 level. In our worst-case scenario, drawdown levels could reach 3,865 and 3,600.
- The data in Figure 6 illustrates years in which the S&P 500 yielded returns exceeding 10% in the first half of the year but performed poorly in the previous year. The average 2nd half performance stands at 12.92%. Historical records indicate that the second half of those years experienced an average drawdown of 6.47%, with 1975 exhibiting the most severe drawdown at 14.1%. If history repeats itself, drawdowns of 6% or 14% could result in the S&P 500 reaching levels of 4,223 or 3,865, respectively (Figure 7). We consider the worst-case scenario to involve a 20% drawdown, potentially pushing the S&P 500 down to the 3,600 level. However, a more prudent investment strategy would involve accumulating positions at drawdown levels of 6%, 14%, and 20%, rather than waiting for a 20% drawdown to occur.
Figure 6: In the year when the S& 500 returned more than 10% in the first half of this year, it was negative in the prior year (Since 1940)
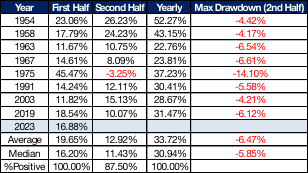
Source: uSMART, Bloomberg, 22 Jul 2023
Figure 7: Estimated Max 2H Drawdown
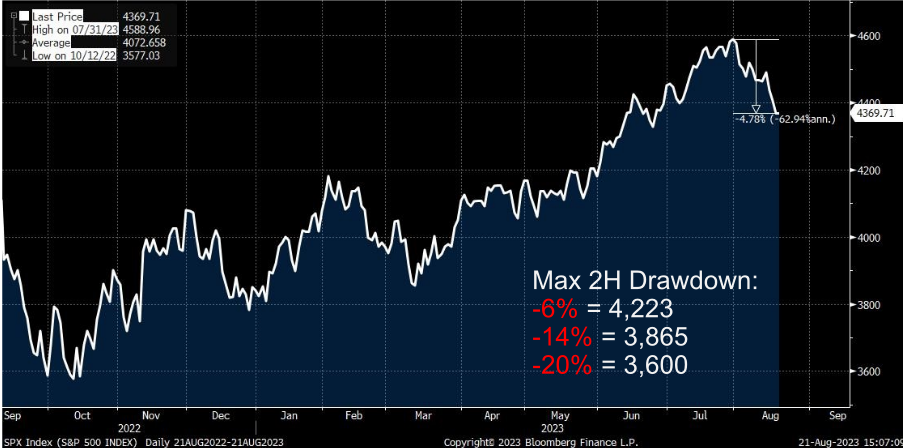
Source: uSMART, Bloomberg, 21 Aug 2023
【Follow us】
Find us on Twitter, Instagram, YouTube, and TikTok for frequent updates on all things investing.
Have a financial topic you would like to discuss? Head over to the uSMART Community to share your thoughts and insights about the market! Click the picture below to download and explore uSMART app!
Disclaimer:
This article is intended for general circulation and educational purpose only and does not take into account of the specific investment objectives, financial situation or particular needs of any particular person. You should seek advice from a financial adviser regarding the suitability of the investment products mentioned. In the event you choose not to seek advice from a financial adviser, you should consider whether the investment product in question is suitable for you.
Past performance figures as well as any projection or forecast used in this article, are not necessarily indicative of future performance of any investment products. Your investment is subject to investment risk, including loss of income and capital invested. The value of the investment products and the income from them may fall or rise. No warranty whatsoever is given and no liability whatsoever is accepted for any loss arising whether directly or indirectly as a result of this article. Overseas investments carry additional financial, regulatory and legal risks, you should do the necessary checks and research on the investment beforehand.
The information contained in this article has been obtained from public sources which the uSMART Securities (Singapore) Pte Ltd (“uSMART”) has no reason to believe are unreliable and any research, analysis, forecast, projections, expectations and opinion (collectively “Analysis”) contained in this article are based on such information and are expressions of belief only. uSMART has not verified this information and no representation or warranty, express or implied, is made that such information or Analysis is accurate, complete or verified or should be relied upon as such. Any such information or Analysis contained in this presentation is subject to change, and uSMART, its directors, officers or employees shall not have any responsibility for omission from this article and to maintain the information or Analysis made available or to supply any corrections, updates or releases in connection therewith. uSMART, its directors, officers or employees be liable for any or damages which you may suffer or incur as a result of relying upon anything stated or omitted from this article.
Views, opinions, and/or any strategies described in this article may not be suitable for all investors. Assessments, projections, estimates, opinions, views and strategies are subject to change without notice. This article may contain optimistic statements regarding future events or performance of the market and investment products. You should make your own independent assessment of the relevance, accuracy, and adequacy of the information contained in this article. Any reference to or discussion of investment products in this article is purely for illustrative purposes only, is not intended to constitute legal, tax, or investment advice of any investment products, and must not be construed as a recommendation, an offer or solicitation for the subscription, purchase or sale of the investment products mentioned. This article does not create any legally binding obligations on uSMART. uSMART, its directors, connected persons, officers or employees may from time to time have an interest in the investment products mentioned in this article.